Xena 100GE Test Modules
Valkyrie 100 Gigabit Ethernet Testing for Layer 2-3
Xena Menu
Ethernet Test Tools
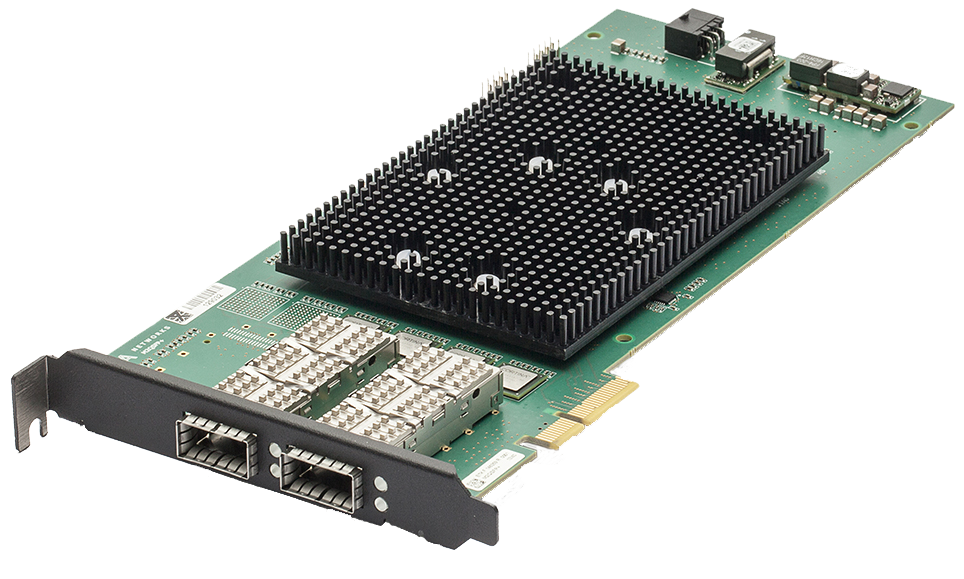
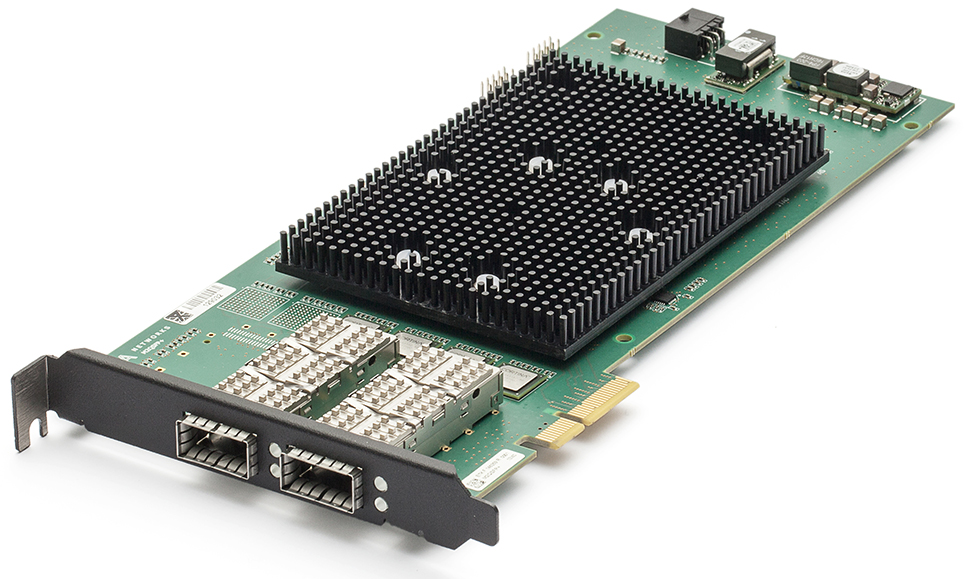
Xena Networks Valkyrie 100GE Test Modules
100GE has matured into a standardized and well-documented technology widely deployed for high speed data communication in e.g. core networks and for Data Center Interconnect. Xena Networks demonstrated its first solution for 100GE in January 2011, and today we offer these advanced test & measurement modules:
| Loki-100G-5S-2P | Loki-100G-5S-1P | Thor-100G-5S-4P | Loki-100G-3S-1P | Loki-100G-3S-1P-B |
|---|---|---|---|---|
2 x 100GE ports 4 x 50GE ports 2 x 40GE ports 8 x 25GE ports 8 x 10GE ports |
1 x 100GE ports 2 x 50GE ports 1 x 40GE ports 4 x 25GE ports 4 x 10GE ports |
4 x 100GE ports 8 x 50GE ports 1 x 40GE ports 4 x 25GE ports 4 x 10GE ports |
1 x 100GE ports 2 x 40GE ports 8 x 10GE ports |
(# of Ports / Speed) 1 x 100GE ports 2 x 40GE ports 8 x 10GE ports |
| A 3-speed test module that supports 3 transceiver form-factors – CFP4, QSFP28 or QSFP+, and CXP. |
Unique 100GE Features
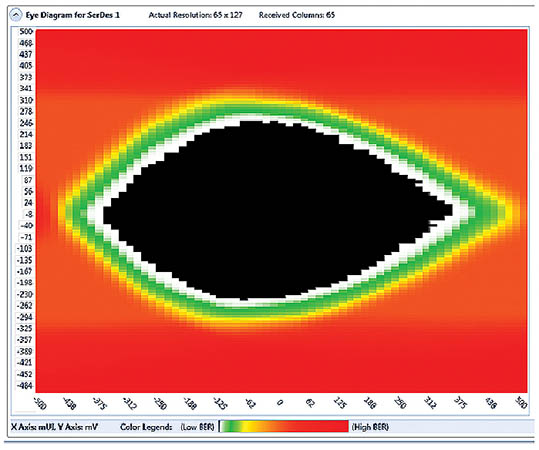
Every 100GE test modules includes a unique feature for analyzing signal quality called the “eye diagram”. When using the QSFP28 ports, an additional panel called “Advanced PHY Features“ will appear in the main Resource Properties tab of XenaManager-2G. This panel controls and monitors the four receive SerDes associated with the 4x10G or 4x25G link at the physical level. It also creates bit-error-rate (BER) eye diagrams, estimates the link BER from the vertical and horizontal BER bathtub curves and controls the PHY tuning in the transmit and the receive directions.
How it works: The BER eye-diagram provides a direct visual representation of the signal quality after RX equalization. The eye-diagram is formed by changing the time dimension (sampling delay) and the amplitude dimension (0/1 threshold) of the sampling point of the PHY step-by-step. For each sampling point (x,y), 1 million bits are measured, the number of bit-errors are counted and a simple division gives the BER. The result is the BER eye-diagram (see below). The color map shows the measured bit-error rate for each point going from 1 million (maximum red) to zero (black). The color scale is logarithmic. Higher resolutions give a clearer diagram and higher values of X and Y will also give a higher precision in the vertical and horizontal bathtub curve estimations, respectively.
What it shows: The eye-data table provides an estimate of several parameters of the eye, including width, height and jitter. Future releases will also include link BER estimates based on the horizontal and vertical bathtub curves.
100GE Pricing
| Loki-100G-5S-2P | Loki-100G-5S-1P |
|---|---|
2 x 100GE ports 4 x 50GE ports 2 x 40GE ports 8 x 25GE ports 8 x 10GE ports |
1 x 100GE ports 2 x 50GE ports 1 x 40GE ports 4 x 25GE ports 4 x 10GE ports |
| Loki-100G-3S-1P-B | Loki-100G-3S-1P |
| (# of Ports / Speed) 1 x 100GE ports 2 x 40GE ports 8 x 10GE ports |
(# of Ports / Speed) 1 x 100GE ports 2 x 40GE ports 8 x 10GE ports |
| A 3-speed test module that supports 3 transceiver form-factors – CFP4, QSFP28 or QSFP+, and CXP. | A 3-speed test module that supports 2 transceiver form-factors: QSFP28 and QSFP+ or CXP. |
| Thor-100G-5S-4P | |
| (# of Ports / Speed) 4 x 100GE ports 8 x 50GE ports 1 x 40GE ports 4 x 25GE ports 4 x 10GE ports |
|
| A 5-speed dual media test module with the unique capability of being able to test both PAM4 and NRZ speeds. |
Unique 100GE Features
Every 100GE test modules includes a unique feature for analyzing signal quality called the “eye diagram”. When using the QSFP28 ports, an additional panel called “Advanced PHY Features“ will appear in the main Resource Properties tab of XenaManager-2G. This panel controls and monitors the four receive SerDes associated with the 4x10G or 4x25G link at the physical level. It also creates bit-error-rate (BER) eye diagrams, estimates the link BER from the vertical and horizontal BER bathtub curves and controls the PHY tuning in the transmit and the receive directions.
How it works: The BER eye-diagram provides a direct visual representation of the signal quality after RX equalization. The eye-diagram is formed by changing the time dimension (sampling delay) and the amplitude dimension (0/1 threshold) of the sampling point of the PHY step-by-step. For each sampling point (x,y), 1 million bits are measured, the number of bit-errors are counted and a simple division gives the BER. The result is the BER eye-diagram (see below). The color map shows the measured bit-error rate for each point going from 1 million (maximum red) to zero (black). The color scale is logarithmic. Higher resolutions give a clearer diagram and higher values of X and Y will also give a higher precision in the vertical and horizontal bathtub curve estimations, respectively.
What it shows: The eye-data table provides an estimate of several parameters of the eye, including width, height and jitter. Future releases will also include link BER estimates based on the horizontal and vertical bathtub curves.
100GE Pricing
| Loki-100G-5S-2P |
|---|
2 x 100GE ports 4 x 50GE ports 2 x 40GE ports 8 x 25GE ports 8 x 10GE ports |
| Loki-100G-5S-1P |
| (# of Ports / Speed) 1 x 100GE ports 2 x 50GE ports 1 x 40GE ports 4 x 25GE ports 4 x 10GE ports |
| A 5-speed test module with a single QSFP28/QSFP+ transceiver cage, and two SFP28/SFP+ transceiver cages. |
| Thor-100G-5S-4P |
| (# of Ports / Speed) 4 x 100GE ports 8 x 50GE ports 1 x 40GE ports 4 x 25GE ports 4 x 10GE ports |
| A 5-speed dual media test module with the unique capability of being able to test both PAM4 and NRZ speeds. |
| Loki-100G-3S-1P-B |
| (# of Ports / Speed) 1 x 100GE ports 2 x 40GE ports 8 x 10GE ports |
| A 3-speed test module that supports 3 transceiver form-factors – CFP4, QSFP28 or QSFP+, and CXP. |
| Loki-100G-3S-1P |
| (# of Ports / Speed) 1 x 100GE ports 2 x 40GE ports 8 x 10GE ports |
| A 3-speed test module that supports 2 transceiver form-factors: QSFP28 and QSFP+ or CXP. |
Unique 100GE Features
Every 100GE test modules includes a unique feature for analyzing signal quality called the “eye diagram”. When using the QSFP28 ports, an additional panel called “Advanced PHY Features“ will appear in the main Resource Properties tab of XenaManager-2G. This panel controls and monitors the four receive SerDes associated with the 4x10G or 4x25G link at the physical level. It also creates bit-error-rate (BER) eye diagrams, estimates the link BER from the vertical and horizontal BER bathtub curves and controls the PHY tuning in the transmit and the receive directions.
How it works: The BER eye-diagram provides a direct visual representation of the signal quality after RX equalization. The eye-diagram is formed by changing the time dimension (sampling delay) and the amplitude dimension (0/1 threshold) of the sampling point of the PHY step-by-step. For each sampling point (x,y), 1 million bits are measured, the number of bit-errors are counted and a simple division gives the BER. The result is the BER eye-diagram (see below). The color map shows the measured bit-error rate for each point going from 1 million (maximum red) to zero (black). The color scale is logarithmic. Higher resolutions give a clearer diagram and higher values of X and Y will also give a higher precision in the vertical and horizontal bathtub curve estimations, respectively.
What it shows: The eye-data table provides an estimate of several parameters of the eye, including width, height and jitter. Future releases will also include link BER estimates based on the horizontal and vertical bathtub curves.
100GE Pricing
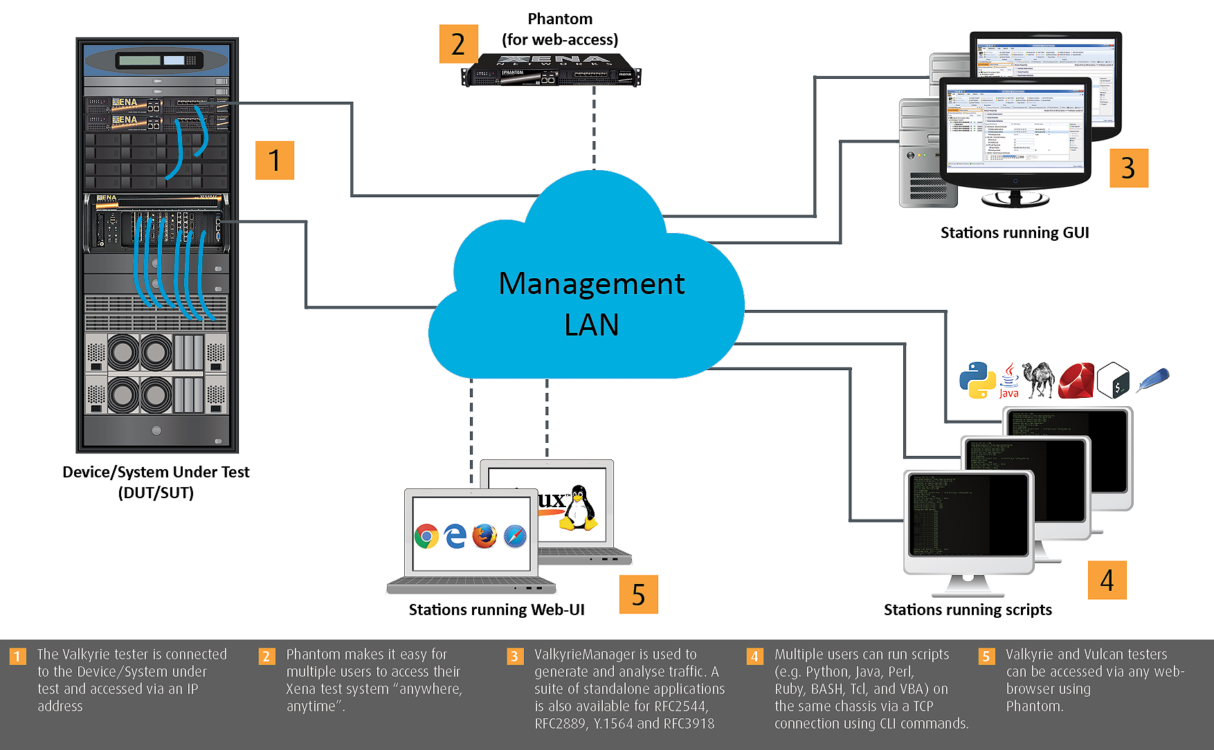
Finally, an open TCP/IP-based text API lets users automate testing from any software environment, using Tcl, Python, Perl, VBA and Java wrappers to convert to/from the generic Xena Command Line Interface (CLI) format.
Pricing is considerably lower than the industry leaders – especially when you factor in our policy of including 3 years’ free software upgrades and HW warranty, plus free training and tech support
Xena is repeatedly praised for being user-friendly. The hardware is easy to install and configure, and the intuitive software really does make life simpler for test engineers
Valkyrie reflects its Scandinavian roots – a quality product loaded with smart “no-fuss” features that delivers great value, from a company that sincerely cares about customer satisfaction.
Why choose Valkyrie?
Valkyrie is a full-featured Layer 2-3 stateless traffic generator and analysis platform. It is used to configure and generate Ethernet traffic at all speeds up to 400GE, and analyze how network devices and services, perform in response, making it perfect for most lab-based data-plane test scenarios.
Related Pages
L2-3 Ethernet Testing
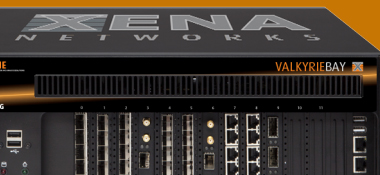
ValkyrieBay
12-slot chassis, high port density, low power usage.
L2-3 Ethernet Testing
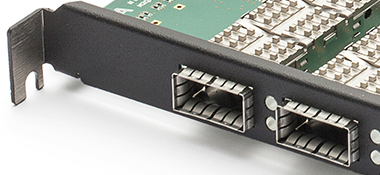
Test Modules
Xena test modules all Ethernet speeds to 400GE
Management
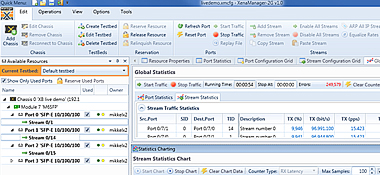
Valkyrie Manager
Easy to use!
Powerful software.

Ethernet Testing
White Papers
A wide variety of white
papers & case studies.